Plot ISC earthquake data
Goal
This explains how to load earthquake data obtained from the ISC catalogue.
Steps
1. Download data
You can get data from the ISC catalogue here: http://www.isc.ac.uk/iscbulletin/search/catalogue/ The catalogue will give you an on screen CSV output that will then have to be copied to a file of your choice (here we will call it ISC1.dat). Do that and start julia from the directory where it was downloaded.
2. Read data into Julia
The main data-file, ISC1.dat, has 23 lines of comments (indicated with #), after which the data starts. We can use the julia package CSV.jl to read in the data, and tell it that the data is separated by ,.
julia> using CSV, GeophysicalModelGenerator
julia> data_file = CSV.File("ISC1.dat",datarow=24,header=false,delim=',')
As this data contains a lot of information that we are not interested in at the moment and which is given in non-numeric formats (e.g. date, time etc.), we will use our helper function parsecolumnsCSV to only extract columns with numeric data.
julia> data      = parse_columns_CSV(data_file, 14)
julia> lon       = data[:,2];
julia> lat       = data[:,1];
julia> depth     = -1* data[:,3];
julia> magnitude = data[:,4];
Converting this data to a GeoStruct data and to export is to Paraview is then straightforward.
julia> EQ_Data = GeoData(lon,lat,depth,(Magnitude=magnitude,Depth=depth));
julia> write_paraview(EQ_Data, "EQ_ISC", PointsData=true)
The result looks like this (plotted here together with the topography):
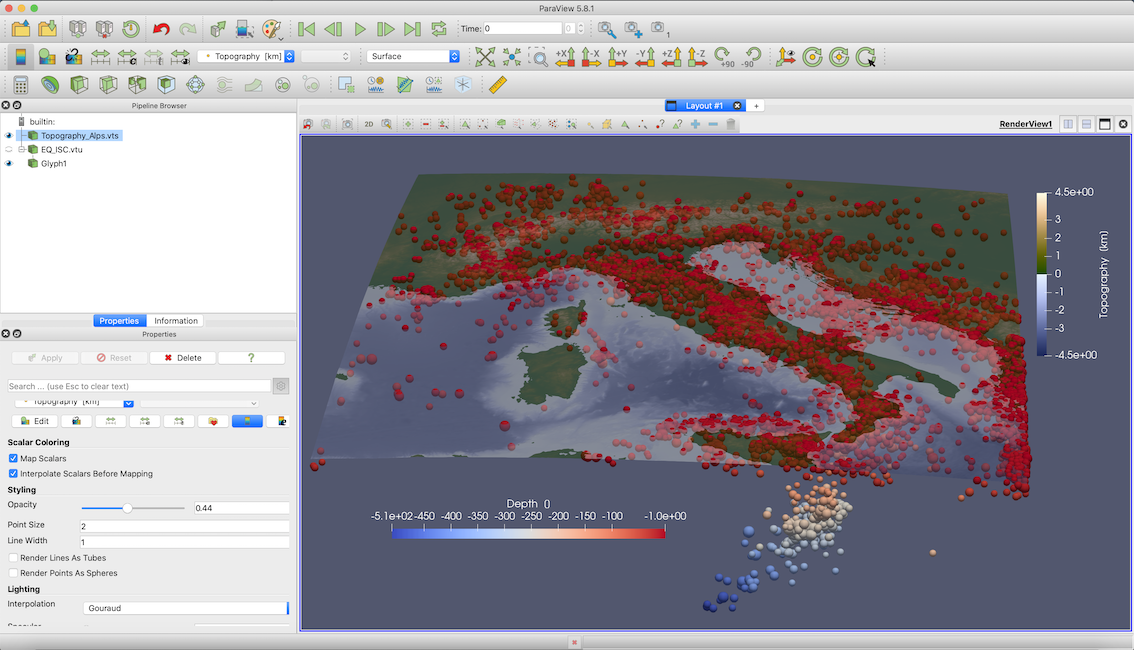
In case you are interested: we are employing the oleron scientific colormap from Fabio Crameri's scientific colormap package here.