Data panels
The panels on the left control what the plot area shows. Switch the toggle in the header of a panel on to expand it. Only one panel is expanded at a time.
Most panels are filled when a profile is loaded, and their content depends on the data in the profile. The panels for surface data, point data and topography stay empty (or say so) if the profile has no such data.
Text fields need Enter
The text fields in the panels (colorbar limits, contour levels, user name) only take a value when you press Enter.
Volume data (tomographies etc.)
The volume data panel controls the heatmap and the contour lines in the profile axis. It is expanded when the window opens.
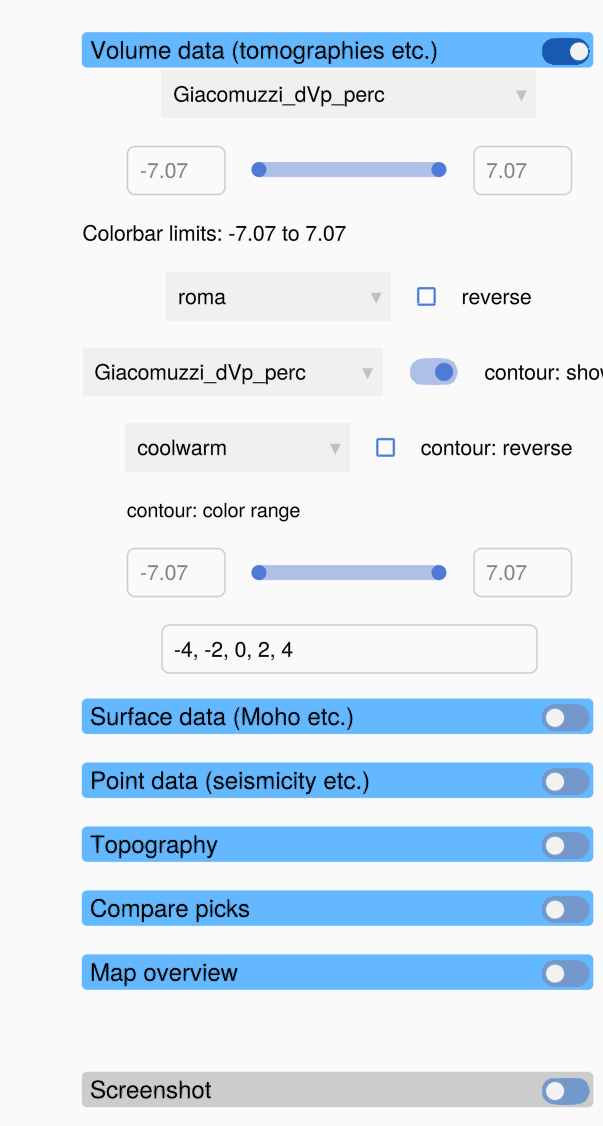
From top to bottom:
| Control | What it does |
|---|---|
| field dropdown | The data field shown as a heatmap, for example Giacomuzzi_dVp_perc. It lists all fields of the volume data of the profile. If several data sets have a field of the same name, the name of the data set is put in front. |
| min / slider / max | The colour limits of the heatmap. Drag the ends of the slider, or type a value into min or max and press Enter. The slider covers ± the largest absolute value of the field, so the limits start symmetric around zero. |
| Colorbar limits | Shows the current limits. |
| colormap dropdown, reverse | The colormap of the heatmap and whether it is reversed. All matplotlib colormaps and the Scientific colour maps of Fabio Crameri (roma, vik, batlow, ...) are offered. |
| contour field dropdown, contour: show | The data field shown as contour lines (it can differ from the heatmap field), and a toggle that shows or hides them. |
| contour colormap, contour: reverse | The colormap of the contour lines. |
| contour: color range | The colour limits of the contour lines (slider and text fields, as above). |
| Contour levels | The values at which contour lines are drawn, separated by commas, semicolons or spaces, for example -4, -2, 0, 2, 4. Leave it empty to get 10 evenly spaced levels inside the contour colour range. |
The colorbars below the plot show the colormaps and limits of the heatmap (top) and of the contour lines (bottom). The contour colorbar is hidden while the contour lines are hidden.
When you choose another field, the colour limits are reset to fit the new field.
Surface data (Moho etc.)
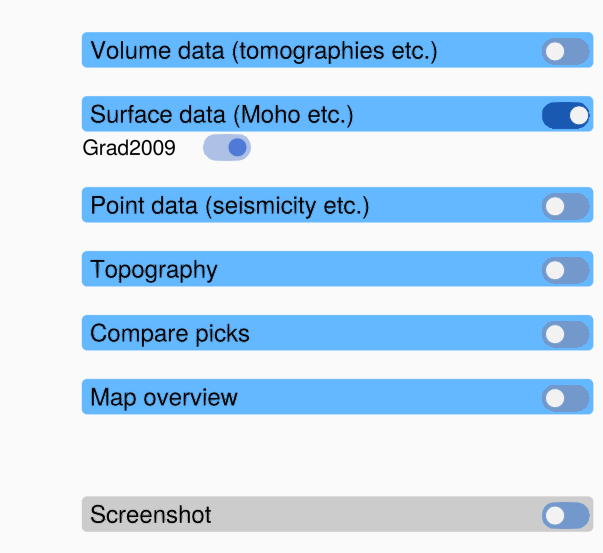
Surface data (for example a Moho model) are drawn as coloured lines with a white outline, so that they stay visible on any heatmap colour. The panel has one toggle per surface. Switch it off to hide the surface. The Surface data legend below the plot names the surfaces; the entry of a hidden surface is greyed out.
Surfaces that do not cross the profile are left out.
Point data (seismicity etc.)
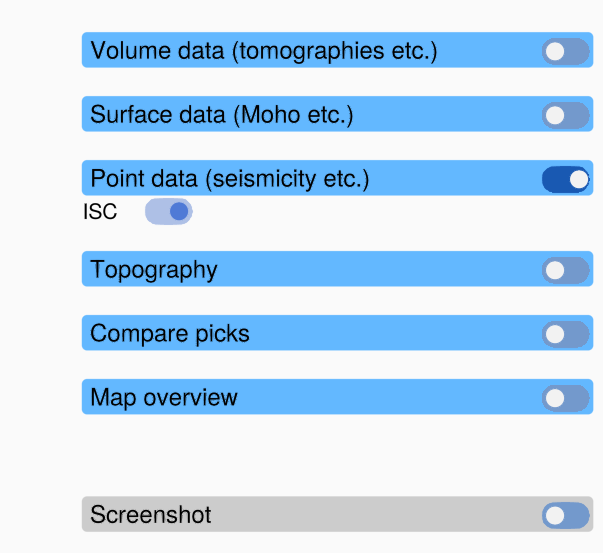
Point data (for example earthquake hypocentres) are drawn as small markers in bright colours. The panel has one toggle per data set, and the Point data legend below the plot names the data sets.
Topography
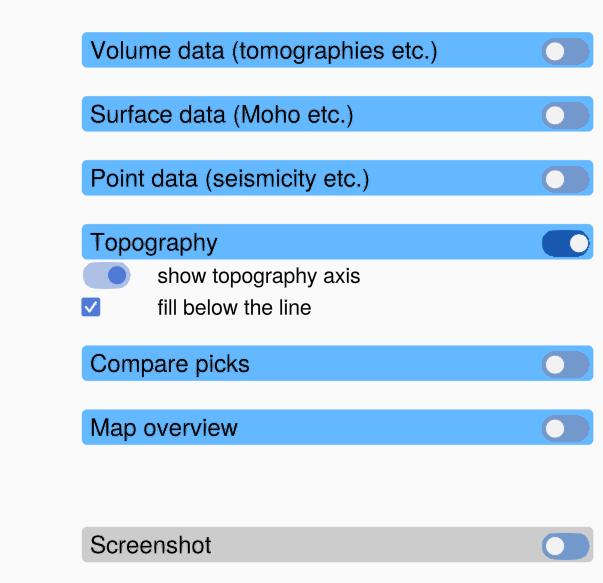
For a vertical profile, the topography along the profile is drawn in the axis above the profile axis. The panel has:
| Control | What it does |
|---|---|
| data set dropdown | Only if the profile has several topography data sets: which one to show. |
| show topography axis | Show or hide the topography axis. When it is hidden, the profile axis takes its space. |
| fill below the line | Fill the area below the topography line (grey above sea level, blue below). |
For a horizontal slice the topography is drawn on top of the volume data instead; see Horizontal slices.
If the profile has no topography data, the panel says No topography data and the topography axis is hidden.
Compare picks
This panel lists the pick files shown for comparison, each with a toggle. It is empty until you load picks with Menu → Load Compare Picks. See Comparing picks.
Map overview
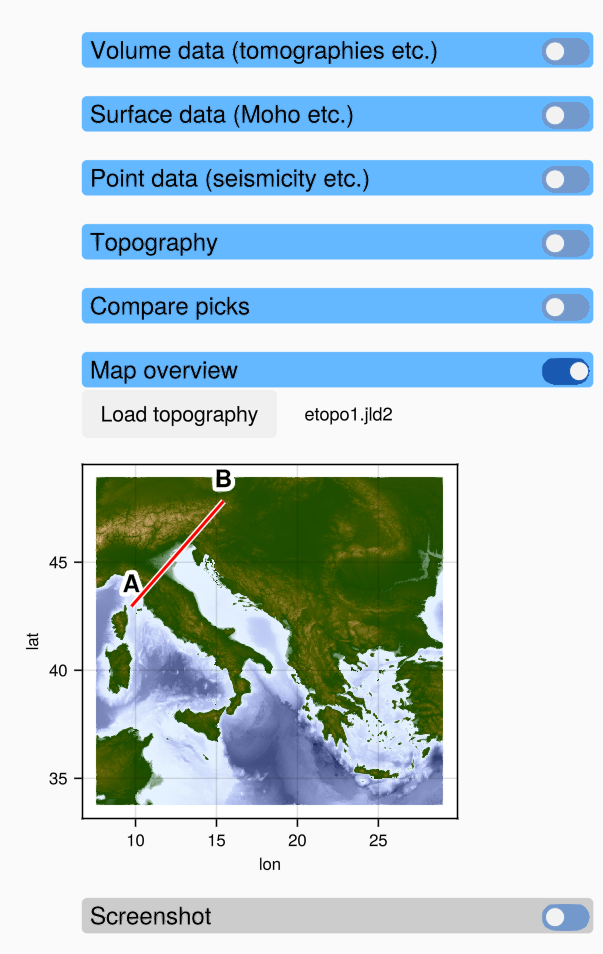
The map overview with etopo1.jld2 loaded.
The map shows where the profile lies. A vertical profile is drawn as a red line from its start A to its end B. A horizontal slice is drawn as a box around its area, labelled with its depth.
The map has no background at first. Click Load topography and choose a JLD2 file that holds a GeophysicalModelGenerator GeoData with elevation data (for example etopo1.jld2) to show a topography map below the profile line. The name of the loaded file is shown next to the button. Very large grids are thinned to about 1000 × 1000 points, so the map stays responsive.
The topography file of the map is remembered in a saved state (Menu → Save State) and loaded again when the state is restored, as long as the file still exists.
Screenshot
This panel has no controls. To save an image of the window, use Menu → Save Screenshot (see Screenshots).