
The window
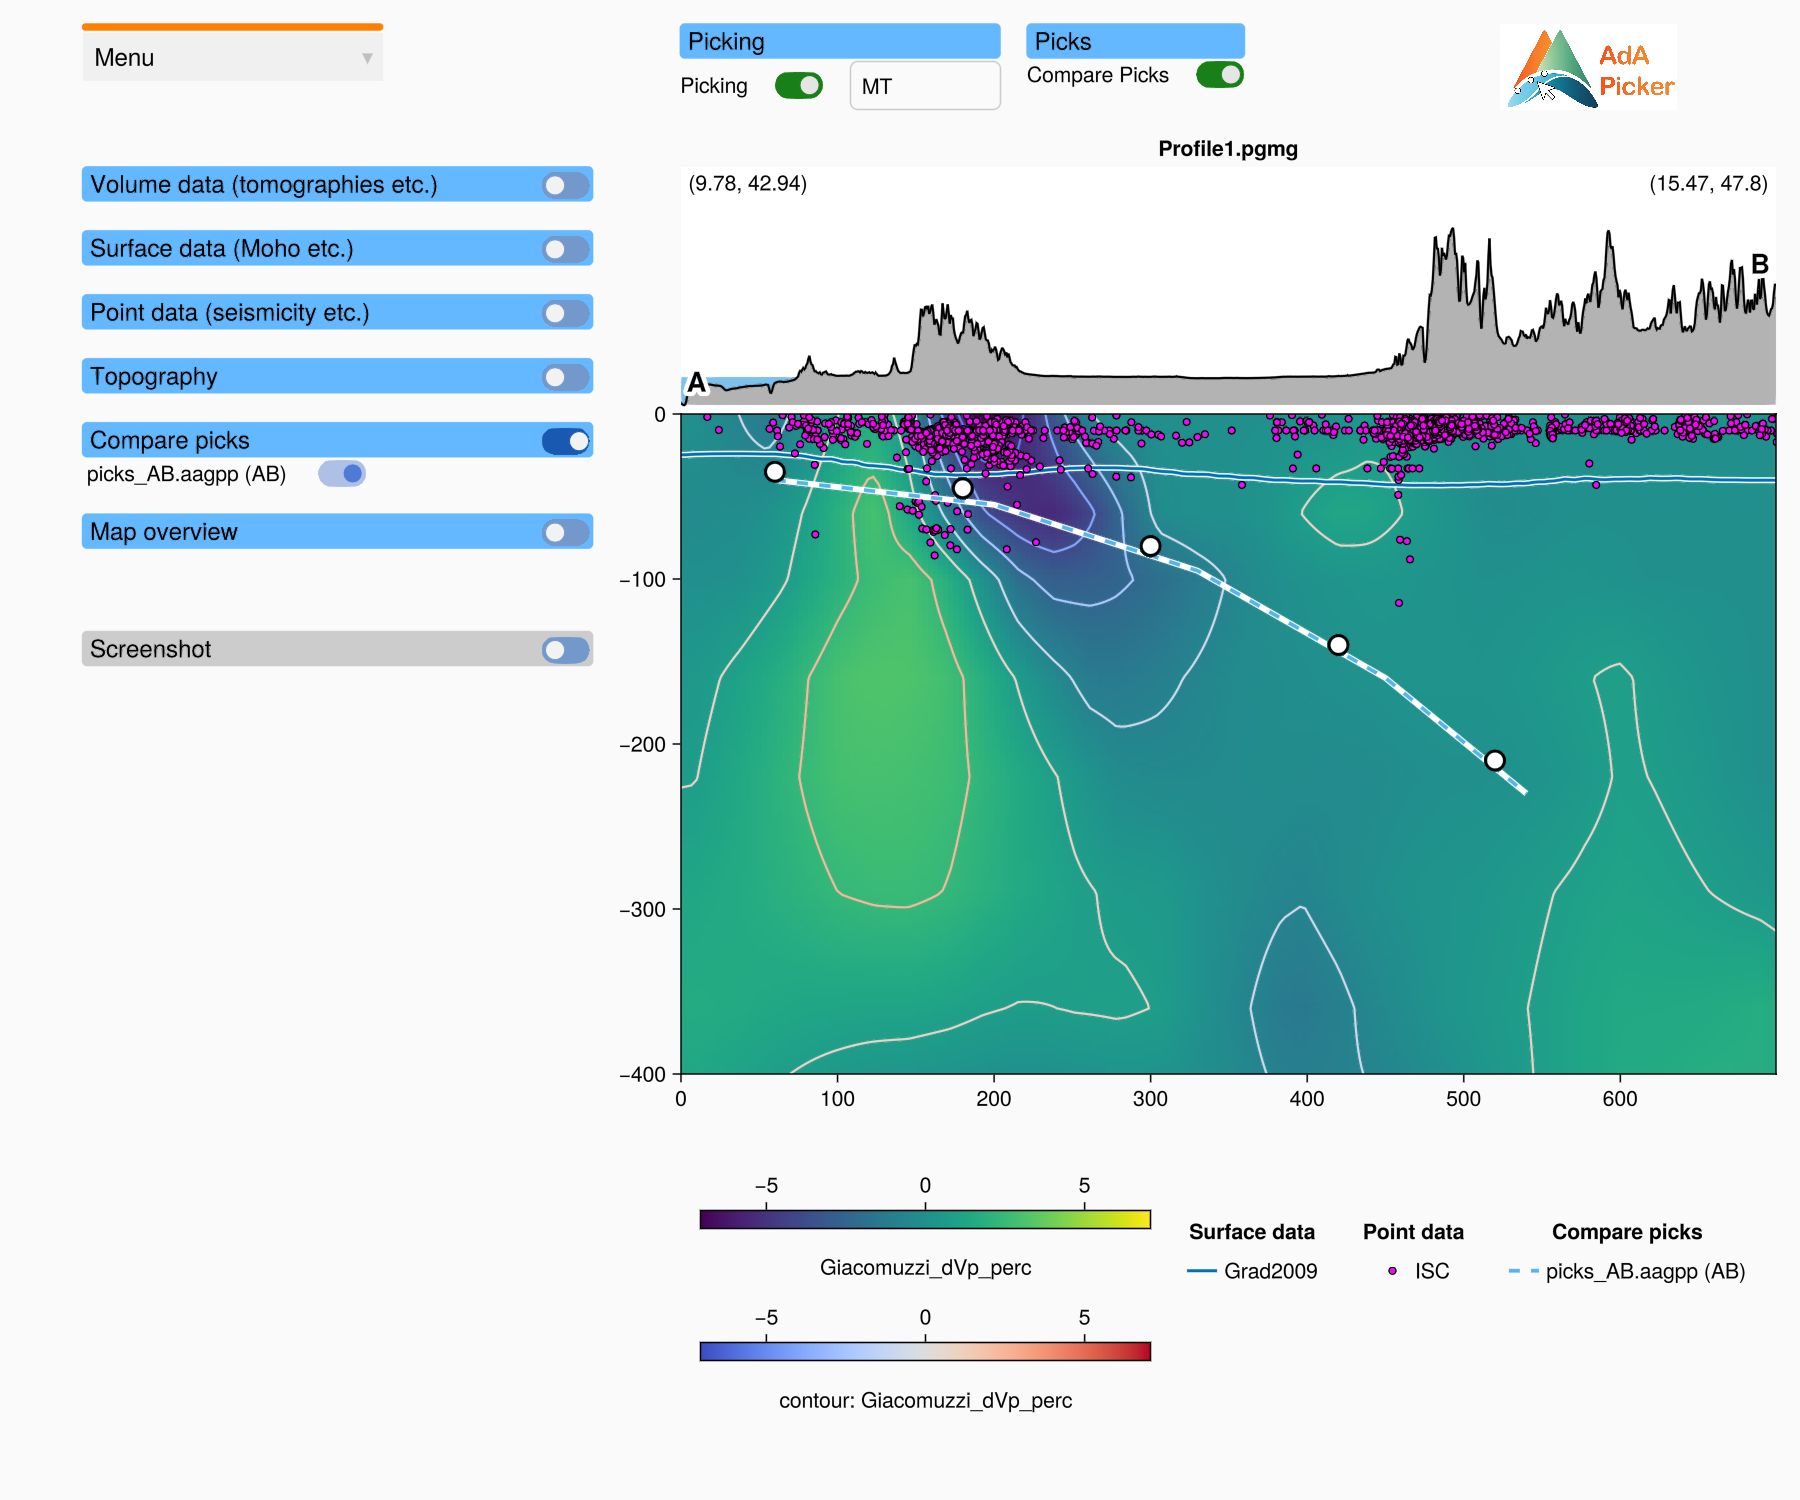
The window has a row of controls at the top, a column of data panels on the left, and the plot area on the right.
┌──────────────┬───────────────────┬─────────────────┬──────────┐
│ Menu         │ Picking           │ Picks           │ logo     │
│              │ toggle, user name │ Compare Picks   │          │
├──────────────┼───────────────────┴─────────────────┴──────────┤
│ Volume data  │ topography axis                                │
│ Surface data ├────────────────────────────────────────────────┤
│ Point data   │ profile axis                                   │
│ Topography   │ (volume data, surfaces, points, picks)         │
│ Compare picks│                                                │
│ Map overview ├────────────────────────────────────────────────┤
│ Screenshot   │ colorbars and legends                          │
└──────────────┴────────────────────────────────────────────────┘
Top row
| Element | What it does |
|---|---|
| Menu | Dropdown with all file actions: load a profile, save and load picks, states and screenshots, close the window. See The menu. |
| Picking toggle | Switches picking on (green) and off (red). Picks can only be added, moved or removed while it is on. See Picking. |
| User name field | Your name or initials. It is stored with the picks you save. Type the name and press Enter. |
| Compare Picks toggle | Shows or hides all picks loaded with Load Compare Picks. See Comparing picks. |
The menu
Click Menu and choose an entry. Each entry opens a file dialog where needed.
| Entry | Action |
|---|---|
| Load Profile | Open a GMG profile (.pgmg). |
| Save State | Save the path of the profile, the settings of the window and the picks (.aagps). |
| Load State | Restore a saved state (.aagps, or a .jld2 state file of MakiePickerGUI.jl). |
| Save Picks | Save the picks to a .aagpp (JLD2) or .csv file. |
| Load Picks | Load picks from a file, so that you can edit them. Only picks of the loaded profile are accepted. |
| Load Compare Picks | Show the picks of another file (for example of another person) as a dashed line. They cannot be edited. |
| Save Screenshot | Save an image (PNG) of the whole window. |
| Close | Close the window. |
The file dialogs do not block the window: it keeps drawing while a dialog is open. Messages about what was loaded or saved, and any errors, appear in the REPL (or the terminal), not in the window.
Plot area
The plot area shows the loaded profile:
The topography axis at the top shows the elevation along the profile. Its title is the name of the profile file. The coordinates (longitude, latitude) of the start and end point of the profile are written in its corners. The start is marked A, the end B, as on the map overview.
The profile axis below it shows the volume data as a heatmap, with contour lines, surface lines, seismicity markers, your picks (white circles) and compared picks (dashed lines). The x axis is the distance along the profile (km) and the y axis is the depth (km, negative downward).
Below, the colorbars of the heatmap and the contour lines and the legends of the surface data, the point data and the compared picks.
The topography axis and the profile axis are linked in x: zooming in one zooms the other.
For a horizontal slice the plot area looks different; see Horizontal slices.
Zooming and panning
The axes use the standard Makie axis interactions:
| Mouse / keys | Action |
|---|---|
| scroll wheel | zoom in and out around the mouse |
| scroll wheel while holding X or Y | zoom only in x or only in y |
| right button drag | pan |
| left button drag (not on a pick) | zoom into the rectangle |
| Ctrl + left click | reset the zoom |
While picking is on, a left click on a pick starts moving that pick instead of zooming (see Picking).
Panels on the left
The column on the left holds the panels that control what the plot area shows. Each panel has a blue header with a toggle on the right. Switch the toggle on to expand the panel. Only one panel is expanded at a time: expanding a panel collapses the one that was open before.
The panels are described in Data panels.