Rheology figures of Becker & Faccenna
This page reproduces figures 5.6, 5.7, 5.10, 5.12 and 5.13 of chapter 5 ("Rheology") of Becker, T.W. & Faccenna, C., Tectonic Geodynamics (draft, 2026), with the creep laws of the GeoParams database and CairoMakie. The flow laws, geotherms and other parameter choices are the authors' (taken from the book and from the script that made the printed figures), so that the figures can be used as a starting point for your own computations.
Each figure is made by one function of the Makie extension of GeoParams. Their keyword arguments default to the book's choices, and the creep laws are keywords too, so any law of the database (or your own) can be plotted instead. The functions are available once a Makie backend is loaded:
using GeoParams, CairoMakieStress and strain-rate conventions
Laboratory flow laws relate the differential stress Apparatus = AxialCompression), using
The printed figures use two other conventions, so the curves below differ from the printed ones by a constant factor:
Fig. 5.12 uses the olivine laws of Table 5.2. Its viscosities are the same as in GeoParams, but its stress axis shows
. At a given strain rate the printed stresses are therefore times higher than here, and the brittle-ductile transitions are 0.3–0.8 km deeper. Figs. 5.6, 5.10 and 5.13 use the stress scale
given below eq. (5.5), i.e. . At the same stress the printed strain rate is times lower than here (3.5 for diffusion creep, 4.9 for the Peierls law of Mei et al. (2010), 6.9 for , 8.2 for ). At the same strain rate the printed stress of a power law is times higher: 1.95 (quartz, ), 1.91 ( ), 1.83 (olivine, ). The bands of Fig. 5.6 and the creep curves of Fig. 5.13 are shifted accordingly; in Fig. 5.10 the strain-rate contours move by 0.5–0.9 orders of magnitude and the diffusion/dislocation boundary by 0.15 log units in stress.
The Byerlee limits, temperatures, water fugacities and water contents are not affected.
Differences to the book's parameters
Apart from the conventions above, the GeoParams database differs from the parameters of the book in a few places. Where the book uses its own choice, the default arguments of the plotting functions override the database value.
| Law | Book (Table 5.1/5.2, script) | GeoParams database | On this page |
|---|---|---|---|
| Wet olivine, dislocation, Table 5.2 (Fig. 5.12) | wet_olivine1_Hirth_2003: | f = 1000^(1/1.2), which gives | |
| Table 5.2, | rounded ( | computed from Hirth & Kohlstedt (2003) | database (stress differs by 0.1 %) |
| Dry olivine, diffusion | |||
| Dry olivine, dislocation (Figs. 5.10, 5.13) | |||
| Quartz, Rutter & Brodie (2004) | database (stresses in Fig. 5.6 differ by −1 to +17 %) | ||
| Quartz, Tokle et al. (2019) | identical | ||
| Quartz, Jaoul et al. (1984), "wet" | database (at | ||
| Quartz, Lu & Jiang (2019) (not used here) | – |
Flow stresses of crustal and mantle rocks
Dislocation creep of water-saturated quartz, feldspar (anorthite) and olivine at
using GeoParams, CairoMakie
PlotFlowStressTemperature()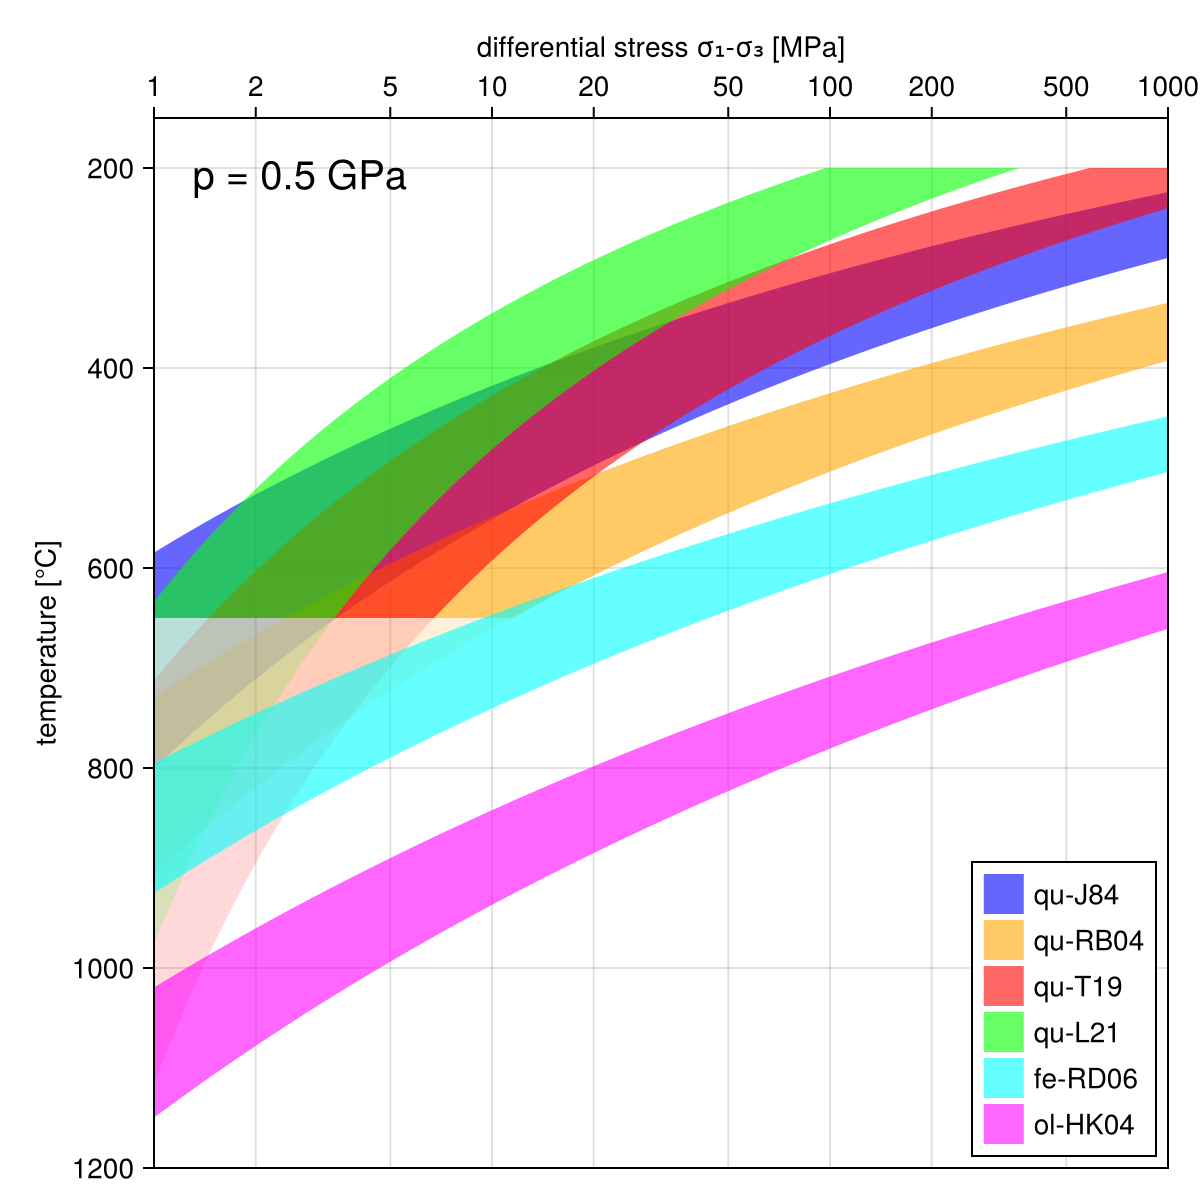
Other laws, pressures or strain rates are passed as keywords. Each law is a named tuple with a label, the law and a color; the water variable f defaults to water saturation:
quartz = [
    (label = "Tokle 2019", law = SetDislocationCreep(GeoParams.Dislocation.wet_quartzite_Tokle_2019), color = :red),
    (label = "Lusk 2021, high p", law = SetDislocationCreep(GeoParams.Dislocation.highP_wet_quartzite_Lusk_2021), color = :green),
    (label = "Lu & Jiang 2019", law = SetDislocationCreep(GeoParams.Dislocation.wet_quartzite_Lu_2019), color = :purple),
]
PlotFlowStressTemperature(; laws = quartz, P = 1.0e9)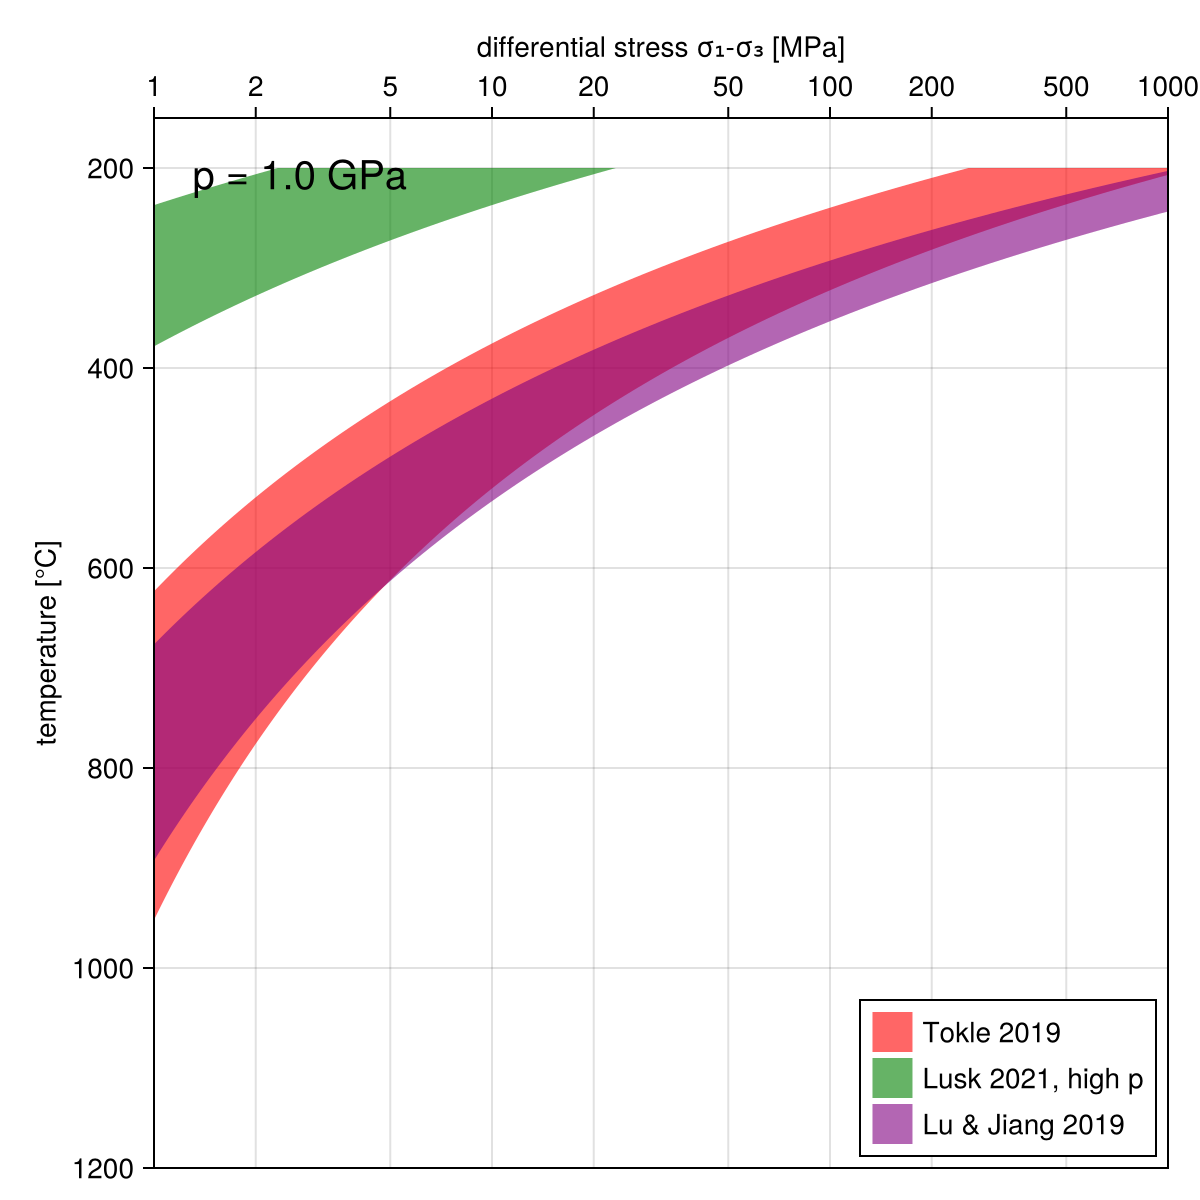
Water fugacity and water content of olivine
Left: water fugacity from the equation of state of Pitzer & Sterner (1994) (colors) and from the crustal approximation of Shinevar et al. (2015), eq. (5.7) (contours every 250 MPa), with two linear geotherms (surface heat flow 50 and 100 mW/m²,
PlotWaterFugacity()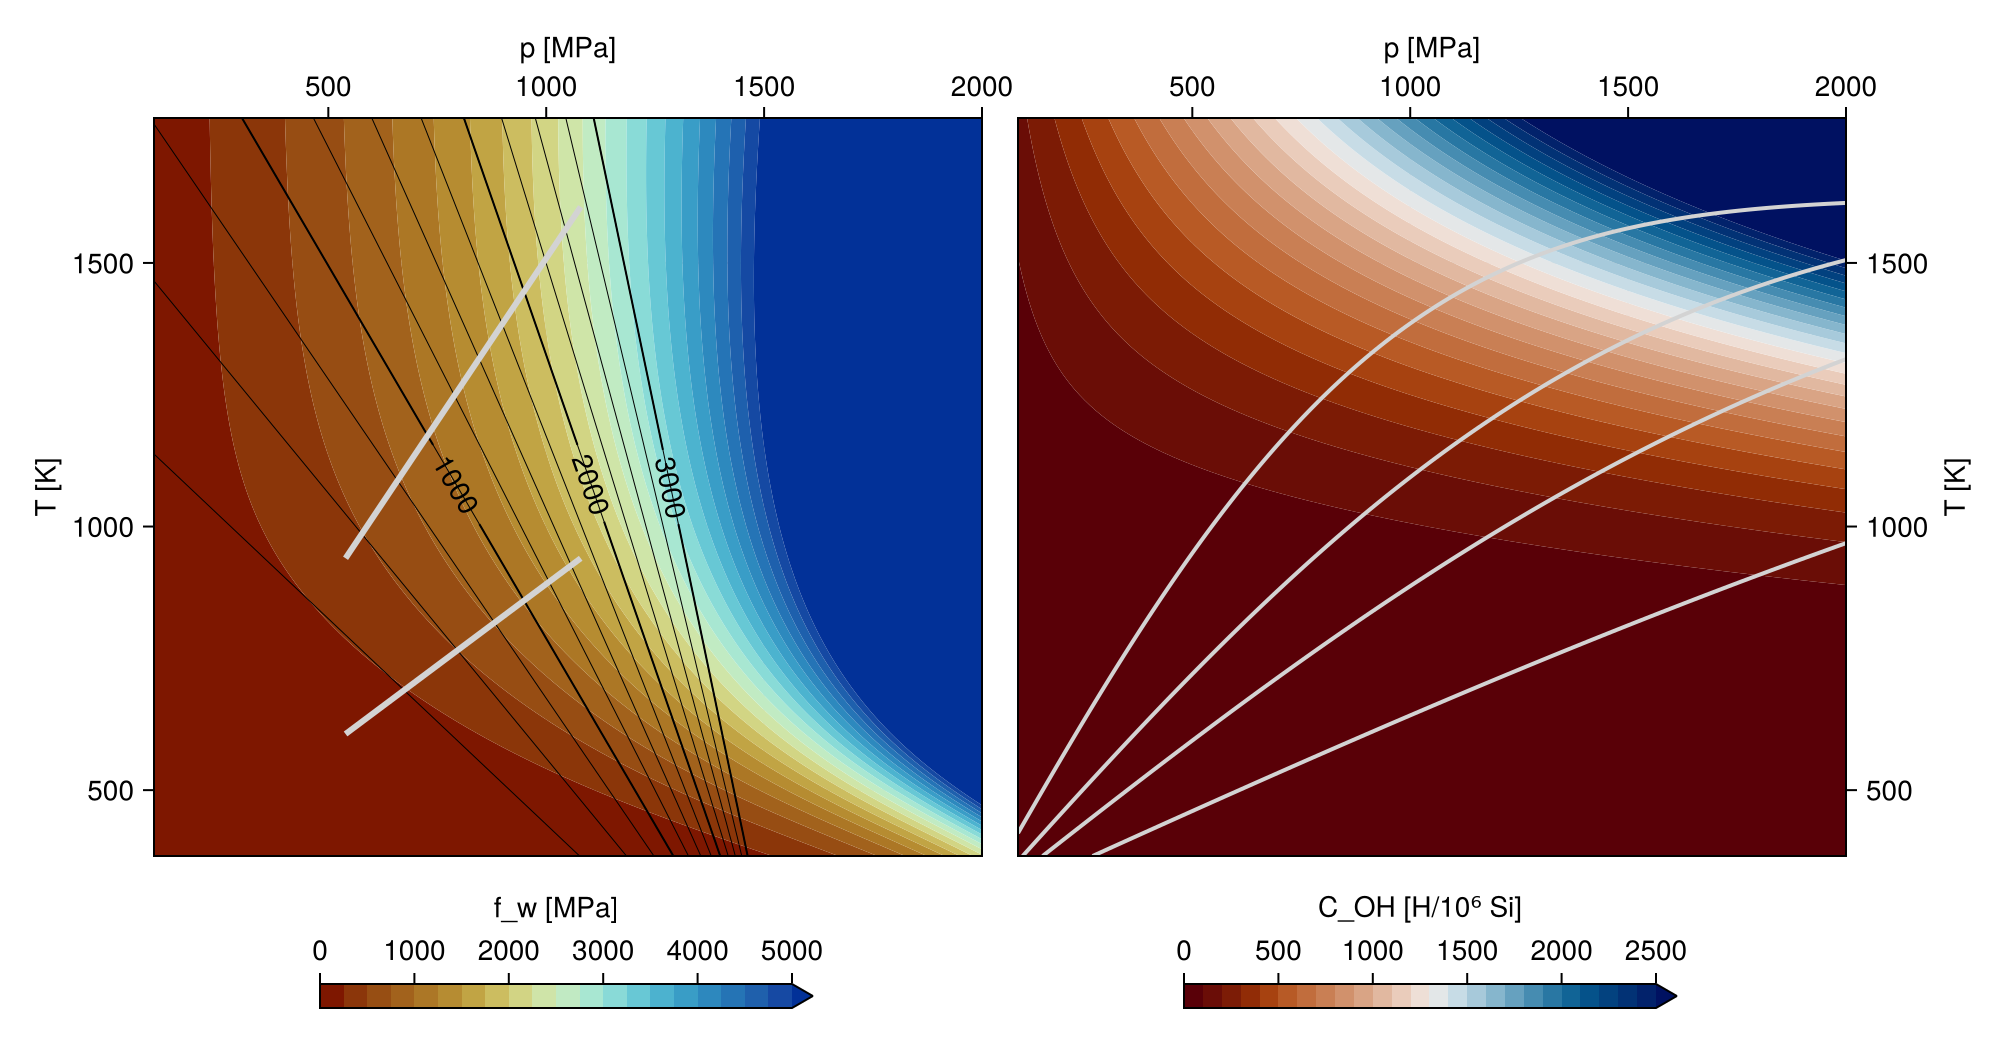
Deformation mechanism maps of dry olivine
Four dashpots in series (eq. 5.29): diffusion creep, dislocation creep and grain-boundary sliding of Hirth & Kohlstedt (2003) and the Peierls law of Mei et al. (2010). For a prescribed differential stress, the strain rate of each mechanism is computed with compute_εII; colors show the dominant mechanism and contours the
PlotDeformationMechanismMaps()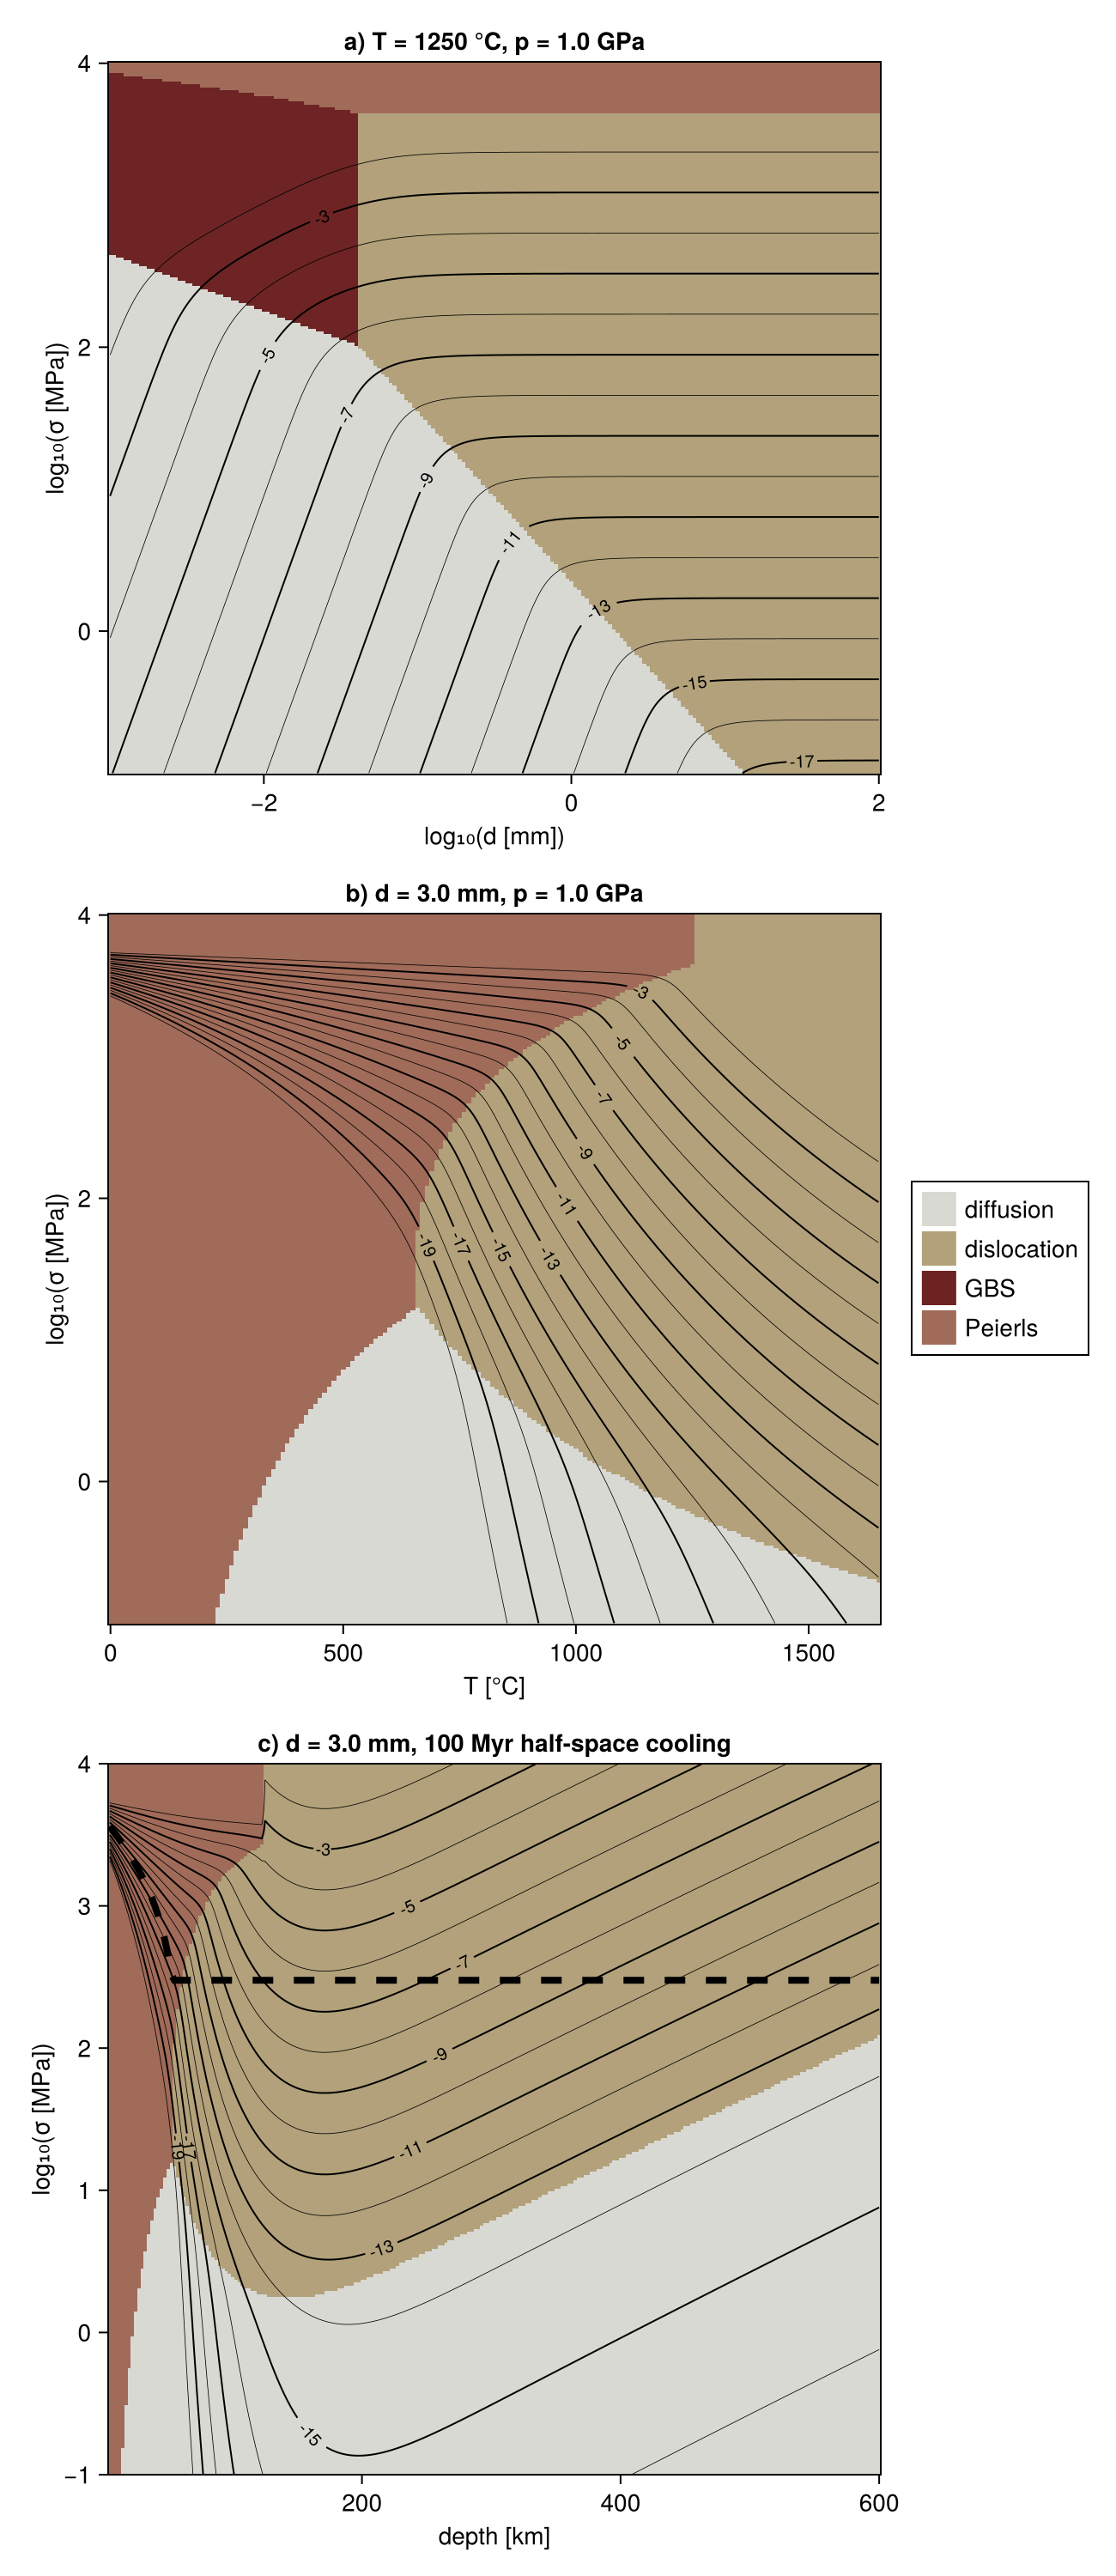
The mechanisms are a list of named tuples (name, law, color), optionally with Tmax [K] above which the mechanism is switched off; law can also be a function of temperature, as for the two GBS regimes. For example, the diffusion creep law of Faul & Jackson (2007) instead of Hirth & Kohlstedt (2003), without GBS and Peierls creep:
mechanisms = [
    (name = "diffusion", law = SetDiffusionCreep(GeoParams.Diffusion.dry_olivine_Faul_2007), color = RGBf(0.85, 0.85, 0.83)),
    (name = "dislocation", law = SetDislocationCreep(GeoParams.Dislocation.dry_olivine_Hirth_2003), color = RGBf(0.7, 0.63, 0.48)),
]
PlotDeformationMechanismMaps(; mechanisms, yield_law = nothing)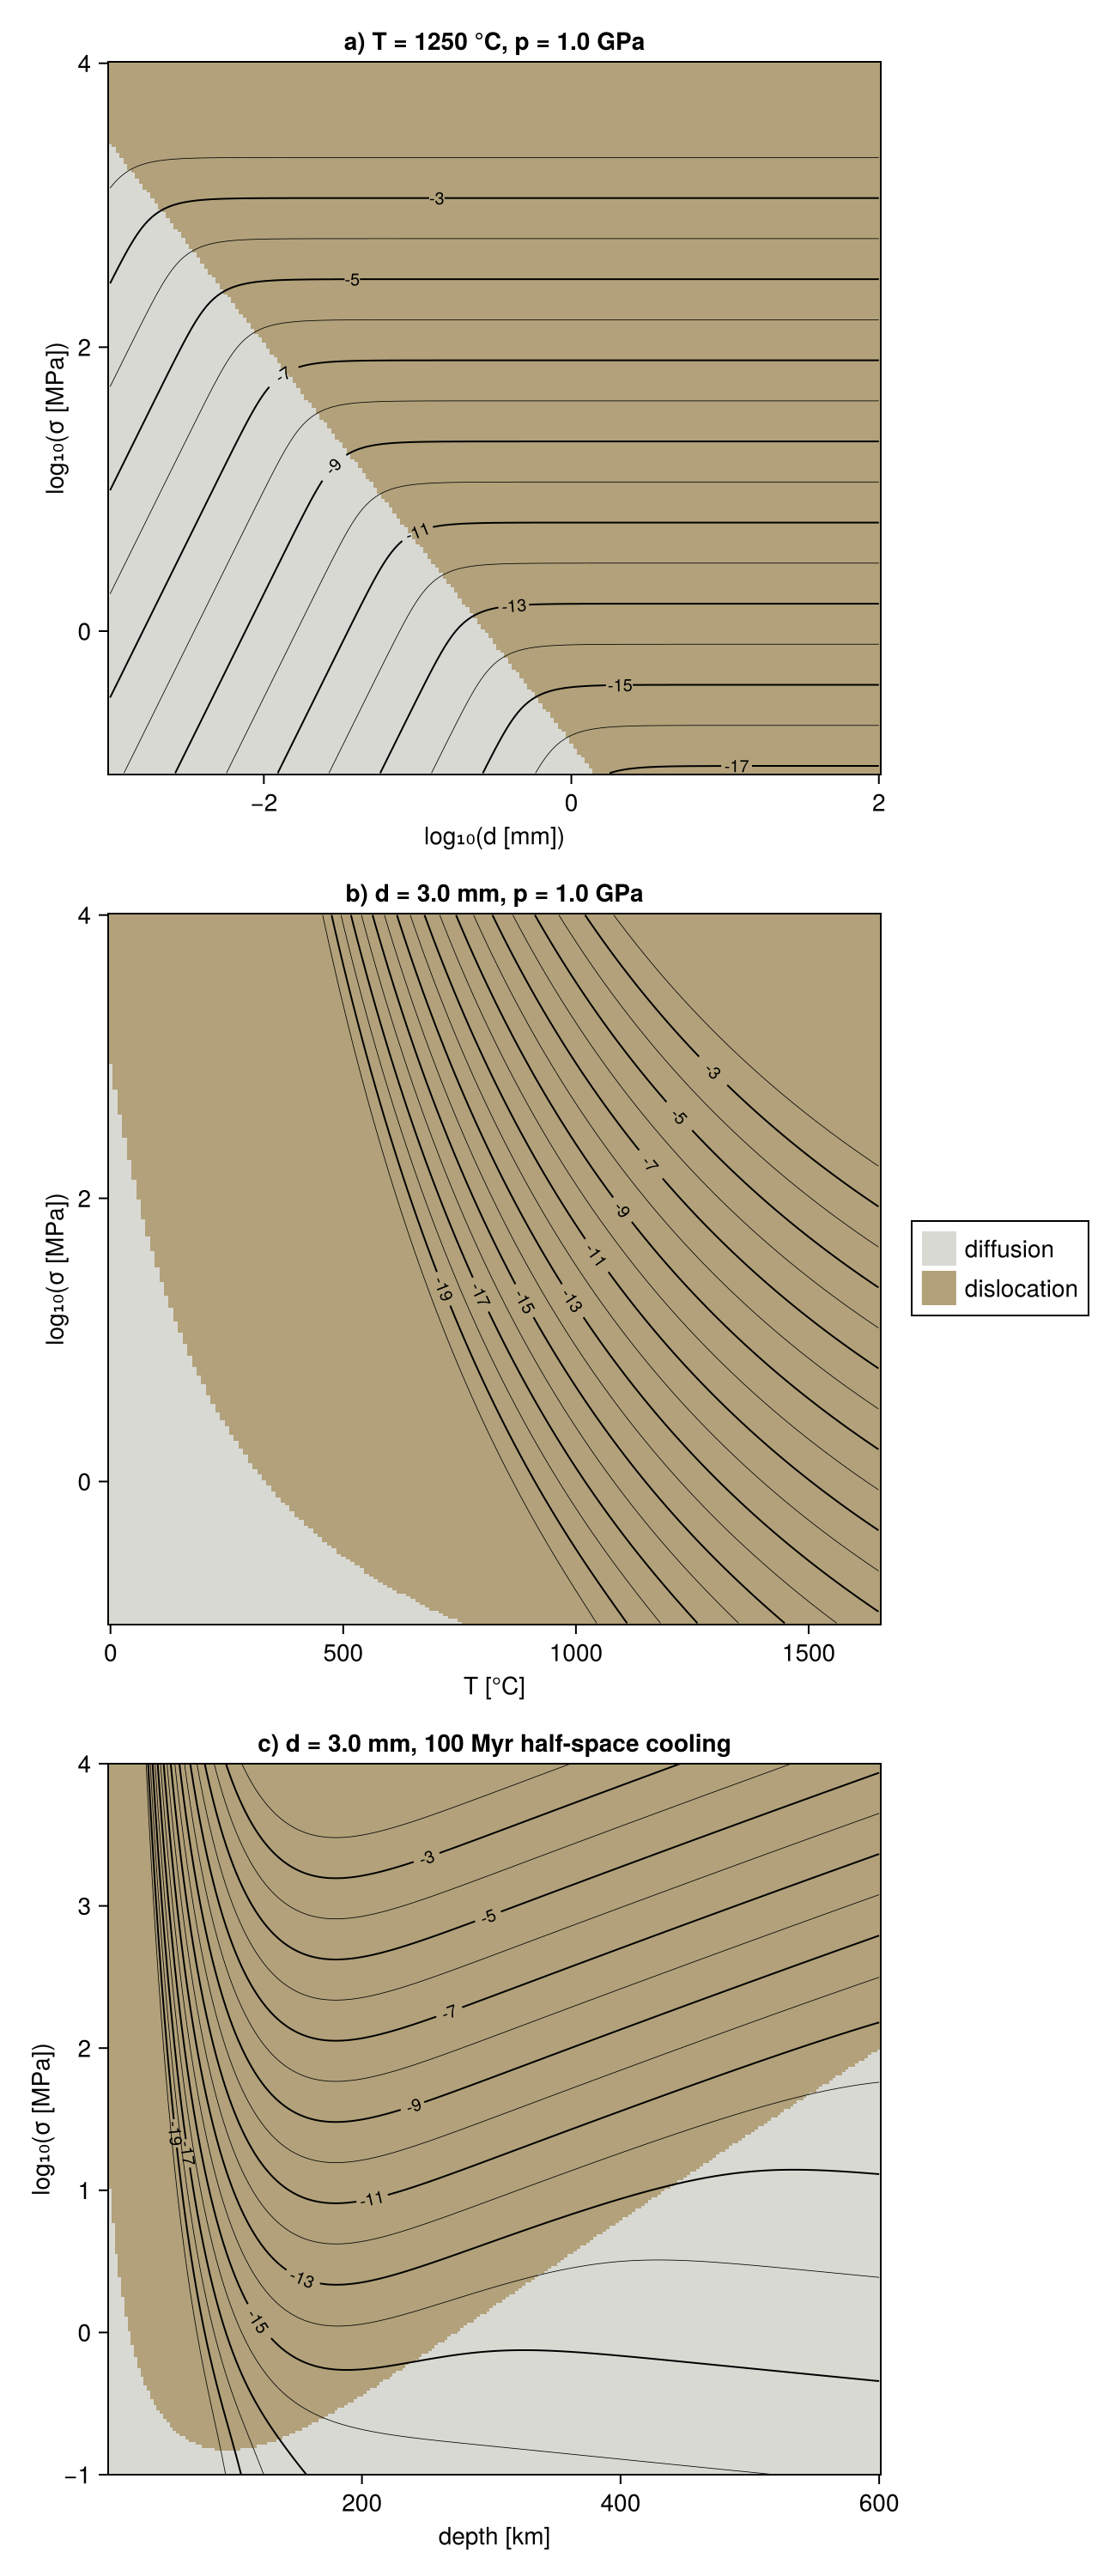
Strength of oceanic lithosphere
Half-space cooling geotherms (
fig, strength = PlotOceanicStrength()
for (key, value) in sort(collect(strength))
    println(key, ": ", round(value, digits = 1), " TN/m")
end
fig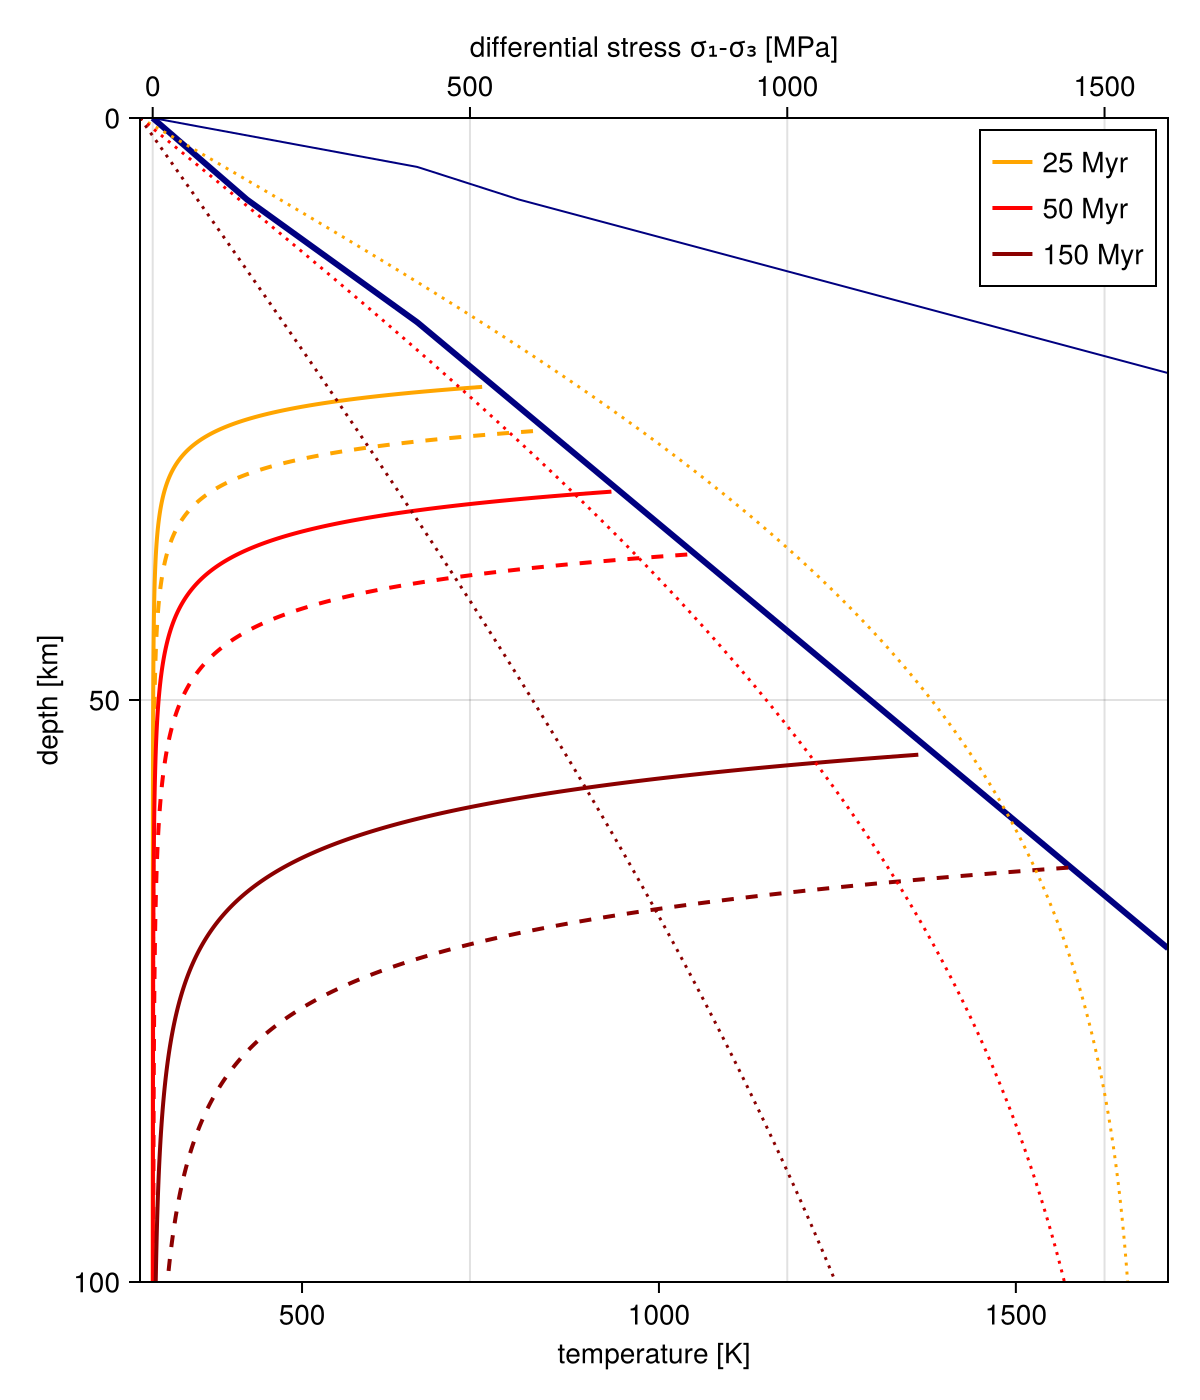
The depth-integrated strengths (0–100 km) printed above can be compared with the 8 (11) and 43 (61) TN/m quoted in the book for the wet (dry) cases at 25 and 150 Myr. The values here are 5–8 % lower. Plotting
Strength of continental lithosphere
Compression with
PlotContinentalStrength()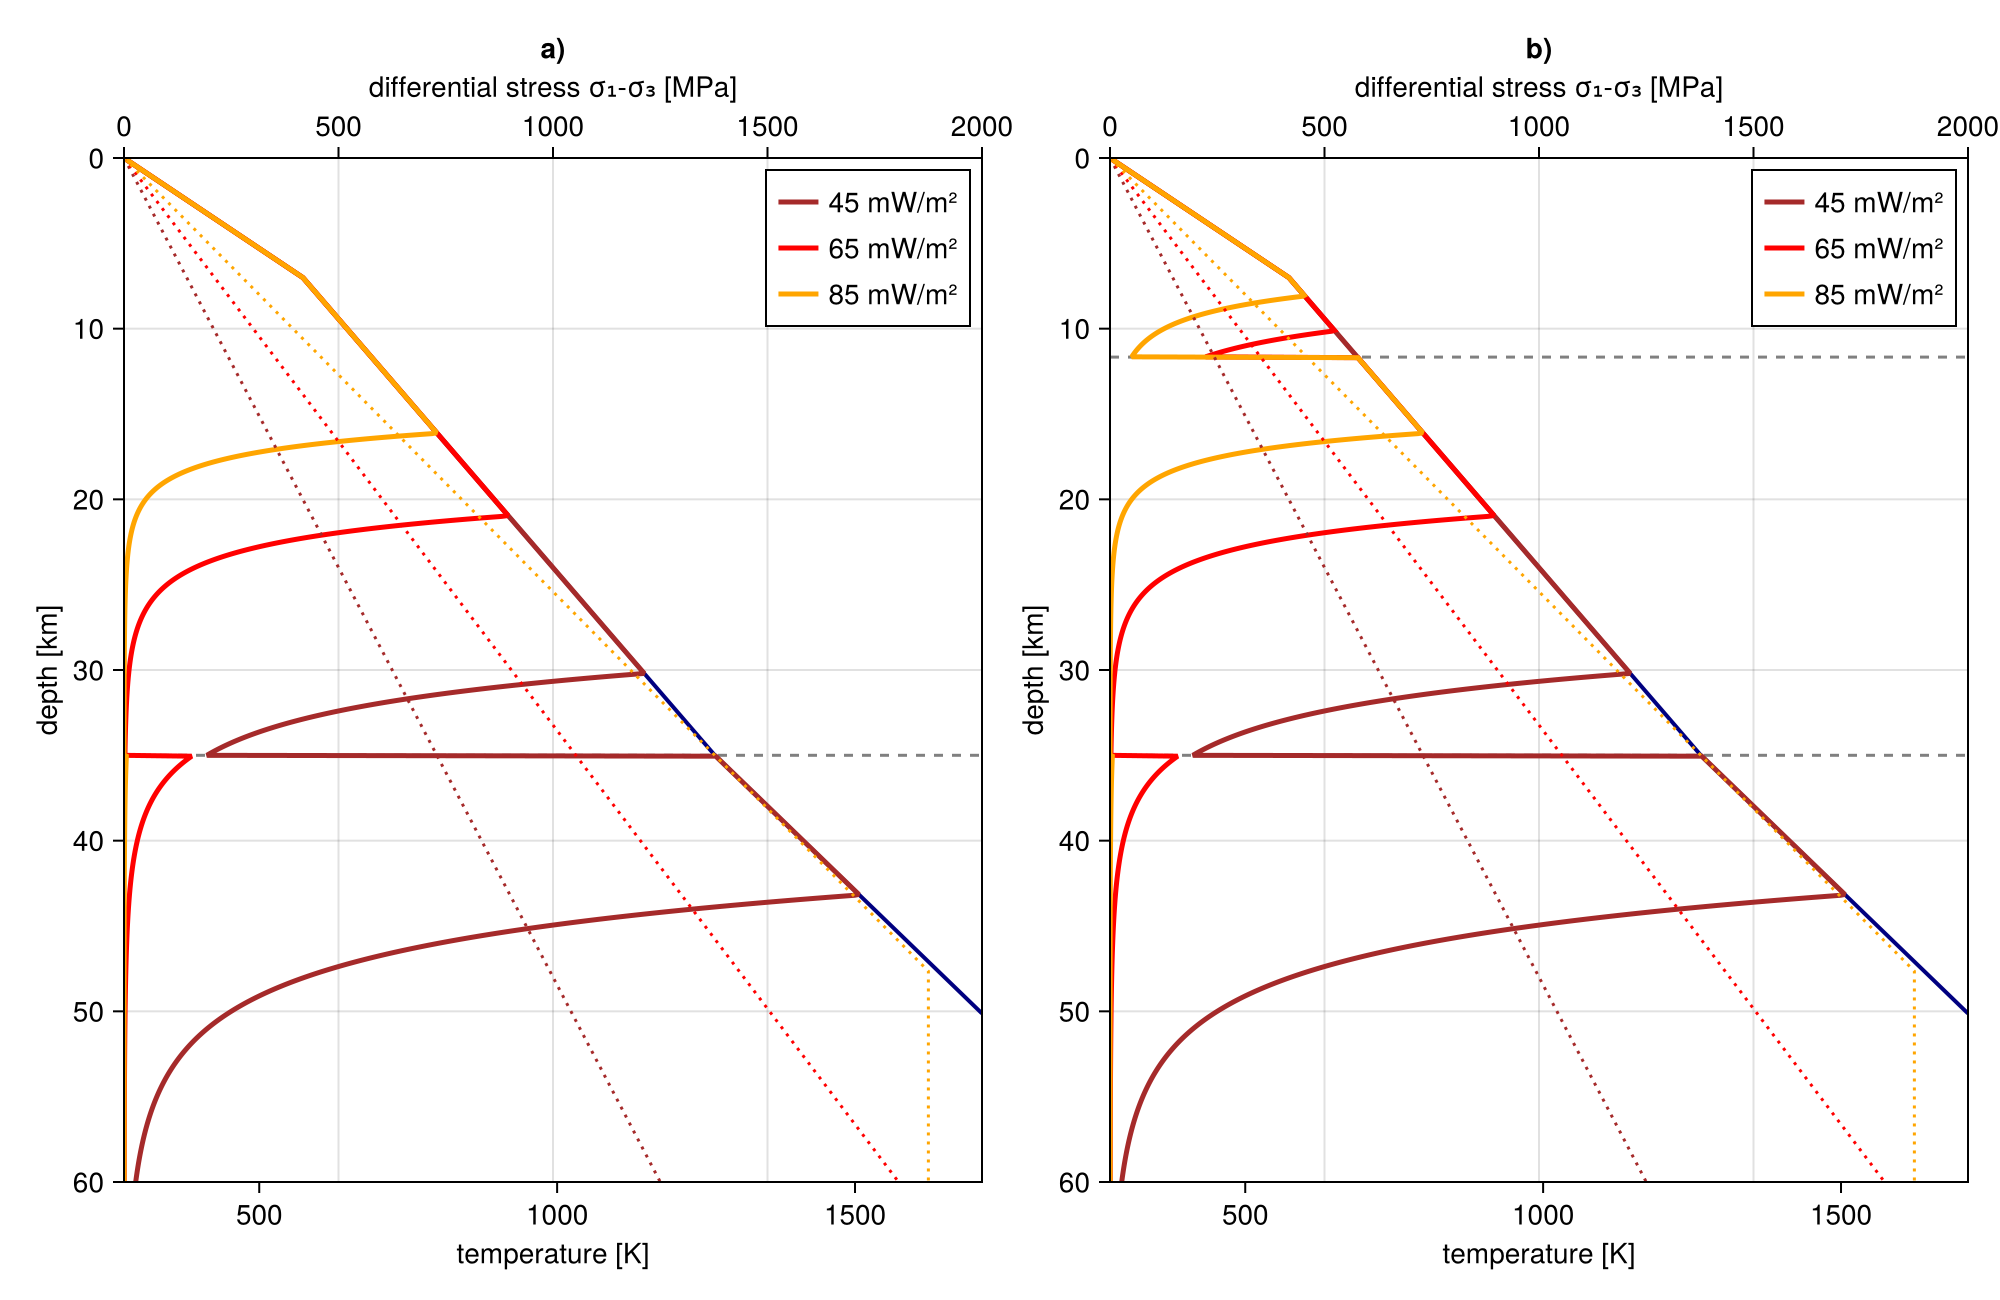
Each panel lists its crustal layers from top to bottom, with the depth of their base; below the last layer the mantle law applies. For example, a granite upper crust over a mafic granulite lower crust:
granite = SetDislocationCreep(GeoParams.Dislocation.granite_Tirel_2008)
granulite = SetDislocationCreep(GeoParams.Dislocation.mafic_granulite_Wilks_1990)
panels = [(title = "granite / granulite", layers = [(bottom = 20.0e3, law = granite), (bottom = 35.0e3, law = granulite)])]
PlotContinentalStrength(; panels, size = (550, 650))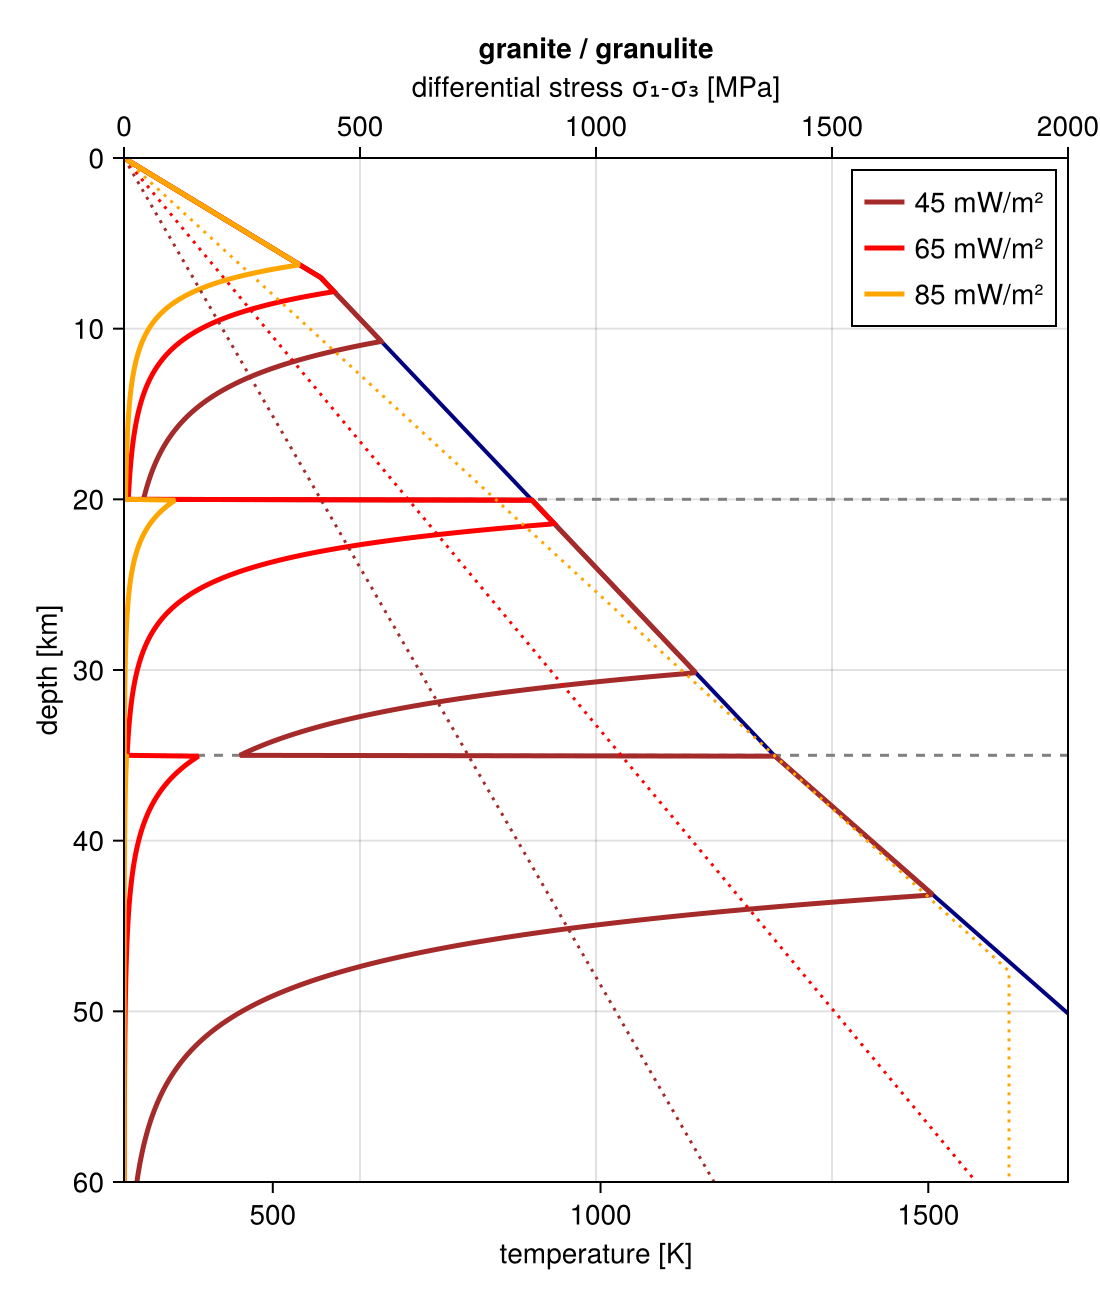
Plotting functions
GeoParams.PlotFlowStressTemperature Function
fig = PlotFlowStressTemperature(; laws, P = 0.5e9, εII = (1e-15, 1e-13), T_C = 200:5:1200, f = compute_water_fugacity)Flow stress of dislocation creep versus temperature (Becker & Faccenna, Fig. 5.6). Each entry of laws is a named tuple (label, law, color) with optional fields f (water variable: a number or a function (P, T) -> f, default: the keyword f, i.e. water saturation) and light_above (°C above which the band is drawn light). Each band spans the strain rates εII. The defaults are the book's quartz, anorthite and olivine laws.
Example
using GeoParams, CairoMakie
laws = [(label = "Tokle 2019", law = SetDislocationCreep(GeoParams.Dislocation.wet_quartzite_Tokle_2019), color = :red),
        (label = "Lusk 2021", law = SetDislocationCreep(GeoParams.Dislocation.highP_wet_quartzite_Lusk_2021), color = :green)]
PlotFlowStressTemperature(; laws, P = 1.0e9)GeoParams.PlotWaterFugacity Function
fig = PlotWaterFugacity(; P, T, heatflow = (0.05, 0.1), ages = (10, 25, 50, 150), Tm = 1623.15, kwargs...)Water fugacity (Pitzer & Sterner 1994) with the Shinevar et al. (2015) approximation, and the water content of olivine at saturation, as functions of pressure P [Pa] and temperature T in K (Becker & Faccenna, Fig. 5.7). Linear crustal geotherms for surface heat flows heatflow [W/m²] and half-space cooling geotherms for plate ages [Myr] are overlaid.
GeoParams.PlotDeformationMechanismMaps Function
fig = PlotDeformationMechanismMaps(; mechanisms, T = 1523.15, P = 1e9, d = 3e-3, age = 100, kwargs...)Maps of the dominant deformation mechanism for creep mechanisms acting in series (Becker & Faccenna, Fig. 5.10): a) stress versus grain size at T, P; b) stress versus temperature at d, P; c) stress versus depth along a half-space cooling geotherm of age Myr (plus dTdz [K/m]). Contours show the total strain rate. Each entry of mechanisms is a named tuple (name, law, color) with optional Tmax [K] above which the mechanism is switched off; law can also be a function T -> law. The defaults are the dry olivine laws of the book (Hirth & Kohlstedt 2003 diffusion, dislocation and GBS, Peierls creep of Mei et al. 2010). yield_law (default Goetze & Evans 1979, nothing to omit) draws the dashed yield stress in c).
Example
using GeoParams, CairoMakie
mechanisms = [(name = "diffusion", law = SetDiffusionCreep(GeoParams.Diffusion.dry_olivine_Faul_2007), color = :gray),
              (name = "dislocation", law = SetDislocationCreep(GeoParams.Dislocation.dry_olivine_Hirth_2003), color = :tan)]
PlotDeformationMechanismMaps(; mechanisms, yield_law = nothing)GeoParams.PlotOceanicStrength Function
fig, strength = PlotOceanicStrength(; laws, ages = (25, 50, 150), εII = 5e-15, Tm = 1673.15, λ = 0.0, kwargs...)Strength of oceanic lithosphere (Becker & Faccenna, Fig. 5.12): creep at strain rate εII along half-space cooling geotherms for plate ages [Myr], limited by Byerlee's law in extension (pore pressure factor λ). Each entry of laws is a named tuple (label, law) with optional f (water variable, number or (P, T) -> f) and linestyle. The defaults are wet and dry olivine of Table 5.2 of the book. strength[(age, label)] is the depth-integrated strength in TN/m.
GeoParams.PlotContinentalStrength Function
fig = PlotContinentalStrength(; panels, mantle, heatflow = (0.045, 0.065, 0.085), εII = 1e-15, λ = 0.4, kwargs...)Strength of continental lithosphere under compression (Becker & Faccenna, Fig. 5.13) for linear geotherms with surface heat flows heatflow [W/m²]. Each entry of panels is a named tuple (title, layers), where layers lists the crustal layers from top to bottom as (bottom, law) with optional f; below the last layer the mantle law applies. Crustal laws use the water fugacity f (default: saturation). The defaults are the book's wet anorthite crust (a) and wet quartz upper crust over anorthite (b), on a dry olivine mantle.
Example
using GeoParams, CairoMakie
granite = SetDislocationCreep(GeoParams.Dislocation.granite_Tirel_2008)
panels = [(title = "granite crust", layers = [(bottom = 35.0e3, law = granite)])]
PlotContinentalStrength(; panels)